Your program and event data is telling you a story. Are you listening?
Data and analytics are more widespread in all departments and have become more than just a to-do item for student affairs professionals.
Data lovers, and those who are going to become data lovers, can learn how data impacts student outcomes, operations, fiscal/budget performance, and higher level institutional decision-making.
We love understanding how real-time data analytics can benefit best retention practices in student affairs.
Data doesn’t lie. But if we’re not paying attention, the stories we’ve been waiting to hear will slip through the cracks.
We want to open up a discussion about what data doesn’t often tell you on college and university campuses and how to improve your data experience so that you can make more sound decisions.
When Data Doesn’t Tell The Whole Story
Often we take numbers and data at face value.
For a number of reasons. We may not have enough time to analyze the data and we aim to grab the data that is most accessible, not necessarily the data we need to analyze.
It can be dangerous. We need to be able to apply a critical lens on data we’re analyzing and self-examine the numbers in front of us.
And it’s not always the data’s fault. As humans in today’s society, we bring our own biases with us and often create structures where it’s hard to interpret what the data is saying. Particularly if the data is coming from data structures that aren’t all inclusive. Ask yourself: what data structures do you currently utilize? Where does our data live (in separate departments or is it a shared collective)?
As real-time data analytics keep progressing in student affairs, reading and interpreting data becomes a more and more valuable skill. Here are a few ideas on how to make better decisions around data.
Developing a Culture of Inquiry
We should use the way other institutions complete assessment as a source of inspiration.
Often, we aim to duplicate what other institutions have found in their data. While it’s great to reach out and benchmark, we need to understand how institutional-specific data will impact student affairs practices first and foremost.

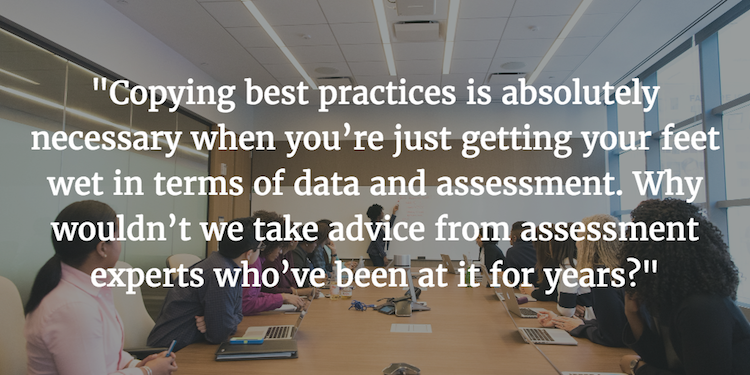
Copying best practices is absolutely necessary when you’re just getting your feet wet in terms of data and assessment. Why wouldn’t we take advice from assessment experts who’ve been at it for years?
We have to pause and recognize our biases around collecting and analyzing data in order to change our perspectives. We need to change inner dialogue from “How does that impact my programs and events, or the students that attend our office?” to “How does this data impact everyone at all levels of the institution?” That’s impactful knowledge that will inspire change.
One area that severely impacts creating a culture of inquiry is the timing of how data is collected and analyzed. Here are a few tips to encourage a culture of inquiry and continuous assessment (not just a one-time deal):
- Bring real-time data analytics to daily or weekly team meetings to share unique trends
- Share programming analytics with student leaders, and help them understand how data can drive better decision-making
- Compile data on a weekly or monthly basis, to make immediate change, and don’t wait to finish that lengthy End of the Year (EOY) assessment report
- Real-time analytics help encourage cross-divisional data sharing, people no longer have to wait for the Student Affairs Divisional Meeting or summer retreat to share relevant and timely information
It’s factors like adjusting the time you review data that can make all the difference.
New Perspectives On Data
Instead of trying to present everything that data is telling us, why don’t we try to understand something distinct and particular about the data? Sometimes when we focus on everything the data may or may not be telling us, we miss important stories.
It’s ambitious to think we can analyze and make sense of all of the data, so we must focus our efforts and find a few individual factors that are important to you (hint: reference your departmental or institutional strategic goals). It’s impossible to cover everything.
Additionally, while you take advice from other departments in what they’re measuring in terms of data collection, your focus will be different.
For example:
- Measuring the ROI of your programming in terms of resources (budget + time)
- Different types of students who show up to your programming and events – which students are most engaged?
- Your specific engagement goals for the year
Can you think of any other factors that make it hard to compare data analytics with other offices?
Student affairs professionals are now outsourcing real-time data analytics to software companies, who can help make decisions around complex correlations in data. It’s often hard to track your own data via an excel document, look at all of the variables among student demographic information, learning outcomes, and student behaviors, and then make decisions around those. Being able to utilize software such as Presence, for example, allows you to make quick decisions around patterns in data to understand the ongoing successes of processes and programs.
Your Thoughts!
We love data here at Presence.
Data influences the success of our institutions, and it’s our choice to analyze and listen to the untold stories that we cannot qualitatively hear through anecdotes or student voices. Collecting, analyzing, and applying data knowledge validates the ‘hunches’ and helps you make real decisions that affect students’ lives. Test everything and keep what works.
How do you aim to change your mindset around data? How do you come together with other departments?
other departments? What resources did you use when just starting out and looking at best data collection, data analyzation, and reporting practices?
Continue the conversation with us on Twitter @hellopresence! Thanks for reading.
P.S. Did you enjoy reading this post? Don’t forget to check out our post on formulating data stories and the importance of data storytelling in student affairs.


