Lawnmower (running over anything in a student’s path), snowplow (pushing obstacles out of the way), velcro (feeling the need to be close) or the infamously known helicopter (hovering) – are all nicknames dubbed to parents and families of college students in the past decade.
As parents and families are increasingly involved with the lives of students, higher education professionals need to understand the dynamic of how families and students make decisions around whether to attend your institution.
We need to remember parents are one of our greatest untapped resources for student success. Family theory has arrived on campus, with evidence that what is happening in a student’s family has a strong effect on the student to focus on academics and day-to-day life.
It’s time to get rid of nicknames and realize parents provide us insight and have a unique role of being able to challenge or support students in different and profound ways: ways that student affairs professionals may not be able to provide.
Partnering with Parents
Opportunities to interact with parents and families are vast if we decide to tap into them.
According to new research from the National Honor Society, many students rely heavily on parental advice when applying for college. Parents and families are often one of the most influential and supportive for students when making decisions about college and involvement on campus.

Accepted student days, orientation, fall preview days, and campus tours set a foundation for professionals to build relationships that will set the tone for the rest of their time at your institution.
Data from NODA (Association for Orientation, Transition, and Retention in Higher Education) indicates that most colleges now provide orientation programming specifically for parents. These sessions, typically offered in conjunction with new student orientation, are designed to give an introduction to what the first year will be like for the student and inform parents about campus services and resources.
In a sea of institutions with similar orientations, you want families to leave with hard data that will help them make a decision and feel reassured.
Encouraging Engagement
One of the best ways to ‘win over’ parents, or show them you’ve really done your research, is showing them hard numbers.
When we present data in compelling ways, it allows our audience (in this case parents and families) to ask questions and be more open about getting to know what the college experience actually looks like for students who want to get involved. When we pull out the deeper meaning behind numbers, it fosters a personal attachment to the presentation and the administrators in the room.
Building Credibility
Data can be powerful when used in the right way.
When we use data to support claims, like how involvement in campus organizations has helped with degree attainment and retention of specific student populations, it shows our audience that we’ve done our research. Use data to encourage your audience to trust you, as a presenter or administrator and the content you share.
Increasing Impact
The act of sharing data is fun, but we need to pull out the significant meaning. At the end of the day, what are some of the most impactful statistics you can share?
Sharing a few statistics and explaining what they mean, helps complete some heavy lifting for your audience. Campus tours or accepted student days are often filled with a lot of information that we throw at families… and we expect it all to stick.
How will you present meaningful data in an easy-to-understand way?
How Data Supports Your Message
As much as we love numbers, we know numbers alone won’t make an impact unless you break them down.
That’s why presenting them in a clear manner is key.

Here are a few techniques to make involvement data stand out and win over parents and families of students through data visualization.
Visualizing Data
Showing data in the form of charts and graphs is a great way to enhance communication about student involvement.
A popular trend in student affairs is utilizing infographics to visualize data to capture an audience’s attention. We provided two examples of infographics focused on student affairs, data, involvement, and student learning outcomes to show what to focus on when it comes to data visualization. These infographics both have a different focus – yet they still teach us a thing or two about how we can communicate with an audience.
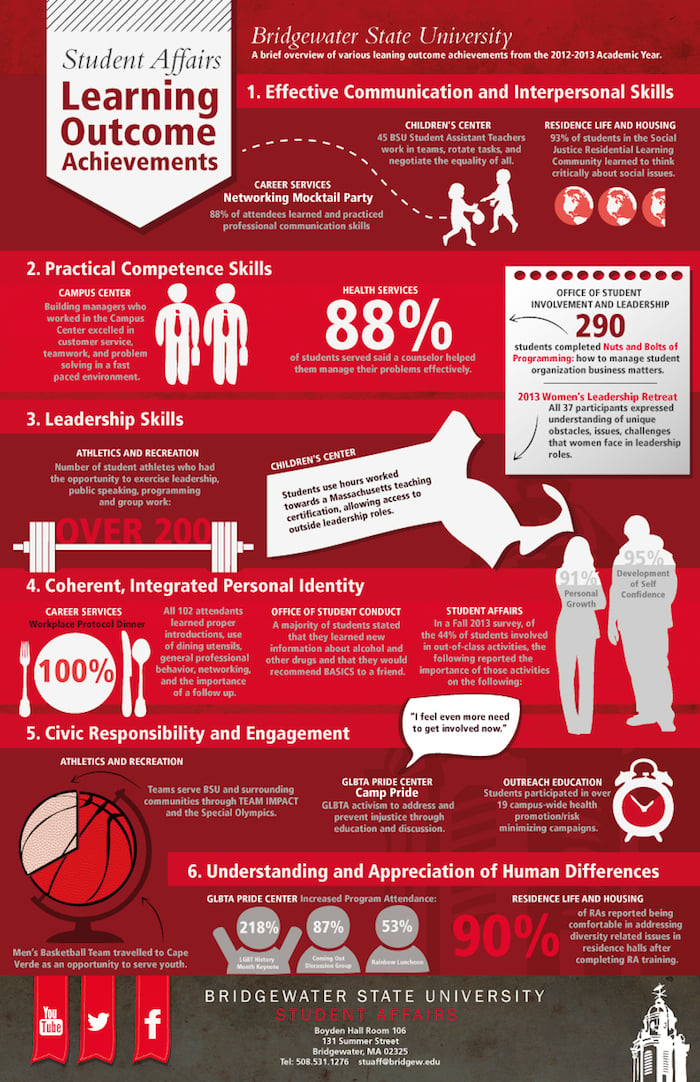
Here is an infographic from Bridgewater State University on learning outcome achievements:

photo from bsustudentaffairs.wordpress.com
This infographic does a great job representing achievements. However the information is presented, but not visualized, which may weaken the impact of some of the data presented. Offering more comparisons between years or organization may strengthen the data presented.
When visualizing data to a specific audience, we must remember to give the viewer valuable context – how are these numbers compared to last year? or last semester? – and not necessarily rely on language (you won’t have time to read it anyway)!
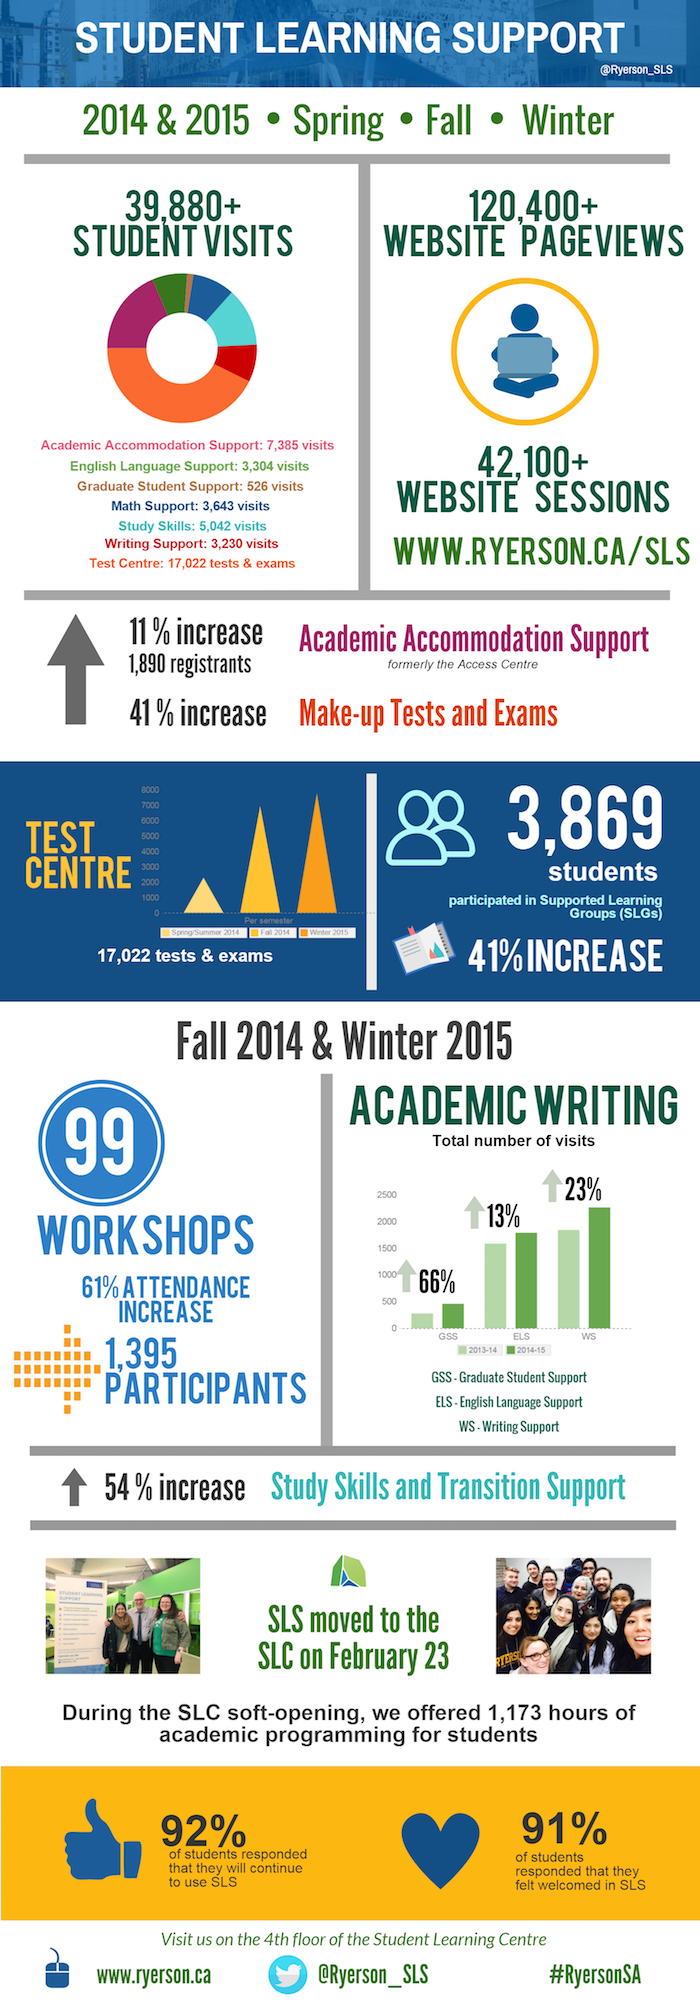
Here’s an infographic from Ryerson University on student learning support:

photo from https://www.ryerson.ca/studentlearningsupport/about/index.html
This graphic presents data in an easy-to-digest way and offers comparisons from both Fall of 2014 and Winter of 2015. The data visualized enables an audience to explore and compare data, providing insight into a larger campus involvement story.
Infographics aren’t the only way to compare assessment data or data analytics. Tap into team’s talent and connect with folks who are passionate about data, comparing statistics, and making meaning. Dive into a demo of Presence to see how you can take student demographic and involvement information to the next level with analytics.
Making Informed Decisions
You want your involvement data to make families or parents feel they’re making the right decision and their student is the right fit for your institution.
The best data visualization answers questions and encourages an audience to ask more.
A visualization of data presented should allow you to:
1. Discover new insights
Example: The majority % of first-year students attended a large-scale program which has shown to make students feel a greater sense of belonging.
2. Communicate quickly and effectively
Example: There was a % increase/decrease in members of this organization (present hypotheses, what you learned, and follow-up action).
3. Add objectivity
Example: This particular involvement data shows why involvement matters on campus and why your student will succeed at our institution.
4. Answer questions
Example: Which major(s) were most likely to attend programs on the weekends? How did this impact student success?
Sharing Data with Campus Stakeholders
The first item to knock off your to-do list is to create a strong bridge with the marketing department at your institution. Now called the ‘digital highway’, institution’s websites are now one of the greatest assets when parents are comparing colleges and universities and presenting them with valuable information. A student involvement landing page presenting notable data will help reinforce information after they leave campus.
One of the largest missed to-do items when preparing for and family presentation is sharing the information with key campus constituents.
For example, take a different angle at prepping for an upcoming accepted student day. Break down top statistics and resources so the Student Activities Office can understand and interpret data from the Multicultural Affairs Office (and vice versa). Sharing information is the key to being prepared to answer any question thrown your way from a parent or accepted student.
Chew on this: appropriately visualizing data helps with delivering information to higher-ups and stakeholders needed to make new campus initiatives successful. Think about end of the year reports and end of semester reports. Reporting and keeping track of data influences a huge audience and reflects internal processes and future decision-making.
What are other steps your institution takes to build relationships with parents through data?
Tweet us @CheckImHere and share! Thanks for reading.
References
Fusch, D. (2016). Leveraging parents as allies in student success. Academic Impressions. www.academicimpressions.com/news/leveraging-parents-allies-student-success-0
Savage, M., & Petree, C. (2015). National survey of college and university parent programs.


