Ah, assessment. It’s the best part of an SA pro’s job, isn’t it?
Okay, sarcasm aside, assessment is critical to our work in the field. And, honestly, it can be pretty fun to scour data in search of insights that have the potential to dramatically shift our approach to programming — that is, if you know where to look!
I’m here to help make assessment approachable and more easily understood. By the end of this post, you’ll know how to make sense of seemingly ambiguous numbers and figures. With that knowledge, you’ll be able to make informed, programmatic decisions that will drive up student engagement.
Let’s dig in!
1. Who are you serving?
It’s easy to look at high attendance numbers and congratulate yourself for a job well done. However, if you dig a little deeper, you may find that your programs aren’t actually as welcoming, accessible, or enjoyable for every student population.
By exploring demographic data (which is easy and customizable through Presence), you’ll be able to see which programs resonate across identities. If you learn that there are underrepresented affinities, you might then ask yourself the following sorts of questions to ensure a more inclusive crowd at your next event:
- Transfer students are not represented in our attendance. How could we provide something that they may enjoy or benefit from next time?
- This program seemed to turn away students of color. Where did we miss the mark? Could it be because our advertising didn’t reach them? Or was the program concept not appealing to them in the first place?
- How could we diversify the offerings at this program to entice a wider range of participants?
2. Which format was the program offered in?
Gone are the days of only holding events in person. Campuses are now offering hybrid, grab-and-go, and remote formats in addition to smaller, in-person gatherings. As you track engagement, pay close attention to which formats seem to be the most accessible to students.
For example, let’s say you have an in-person event capped at 10 attendees and only five folks show up. You also offer a remote option for the same program that’s open to 100 attendees, but see a 90% attendance rate.
There’s a lot to unpack there! The difference in engagement could be due to students feeling uncomfortable in person, off-campus students enjoying a program for which they don’t have to make a trek to campus, or students’ desires — across every demographic — to continue connecting with their peers while relaxing in pajamas.
Regardless, you now have insight in how remote offerings are spiking engagement (as was the case at National Louis Unversity). So, you could either continue offering multiple modalities or you could invest your energy in creating robust remote programming for all to enjoy.
3. What kinds of programs are you hosting?
Students have varied interests, so it’s common for engagement to ebb and flow depending upon the program offerings. However, it’s worth investigating whether there are any particular types of programs that continually draw a bigger crowd.
For example, are you seeing higher attendance numbers at programs that offer students the chance to express themselves creatively? How about ones that offer free food or giveaways? Do high-profile guests prompt a bigger turnout?
In looking at these subtle details, you’ll be able to determine the kinds of programs that foster remarkable social engagement. Host more of them, and you’ll likely see more repeat attendees or eager newcomers.
Keep in mind, though, that as your attendance gets higher, you may risk diluting your learning outcomes. Sometimes, the goal is higher numbers and facilitating more interactions amongst students. Other times, it’s simply about getting quality content to the niche populations who might need it most. Don’t let your success with one goal keep you from addressing the other.
4. Is there a cost associated with your program?
Whether it’s a concert headlined by a major artist or a catered event, there are certainly reasons to charge an admission fee. Pay particular attention to engagement with these opportunities, as there could be financial barriers that inhibit you from reaching the students you’d like.
It’s possible that the allure of the program is enough to entice many students to budget for the event, but as you dig into the specifics of your audience, what do you notice? What percentage of them identify as low-income? Are there other intersectional identities that may also be impacted by the cost?
If you notice (or suspect) that the cost is prohibitive, then you don’t necessarily need to stop planning programs that require paid tickets, especially if engagement is high. But you should find ways to make the experience inclusive for all.
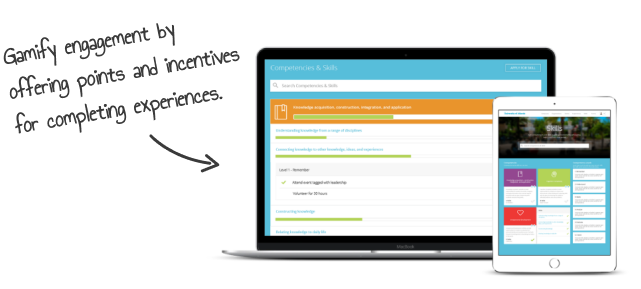
Perhaps you could partner with a resource center on campus to fund discounted tickets or have ticket giveaway opportunities leading up to the event. A good way to approach this is by giving away tickets to students based on points earned from engaging with previous programs, completing leadership tracks, or logging service hours. This gamification technique is easy and fun through Presence!

5. Do you have a “dry” season?
Does your department struggle with the same engagement lulls around the same time each year? Similarly, are there hallmark programs that continually flop? Those numbers may serve as a warning sign to switch up your tactics and timing.
Look back on programs from years past and check out the engagement data. If you notice a period of consistent dips, consider what might be the cause(s). If you’ve checked every other box in the terms of the quality of your programming (such as the program’s accessibility, type, and advertising), is there a seasonal trend that might be to blame?
For example, midterm and final seasons may not be the best time to program — even if you are doing a mindfulness session or offering free face masks. The same could be said for the sixth week of class when first-year students are starting to feel homesick and would prefer to spend their free time on a video chat with family.
On the contrary, it might be great to do a program for the winter holiday season when students are itching to celebrate their respective traditions. Or perhaps you host an impromptu field day program on the first warm day of the semester, when students will inevitably flock to the sunny quad.

Whether the data is quantitative (like the assessment measures I mentioned above), or qualitative (like the opinions students share directly after attending a program), there are goldmines of insight that will allow you to make calculated programming decisions.
While it’s fun to peruse Pinterest or copycat successful programs from peer institutions, events that are catered to your unique student makeup will more likely stand out and bring engagement in.
Though the traditional tendency is to celebrate quality over quantity, I challenge you to underscore the importance of numbers — because you’re charged with serving all of your students, not some of them. Though it isn’t essential to have the highest possible attendance at every single event, it is critical that we are hosting robust catalogs of programs that benefit everyone. Fortunately, the numbers can guide you to do exactly that!
How have you used data to guide your decision-making? We’d love to hear your stories! Connect with us @themoderncampus.
And if you’re itching to get access to better, more informative data — along with highly customizable tools to empower increased engagement — Presence is ready for you! Learn more here.


