
After my post overviewing outcome maps, I think it’s only appropriate to follow up with a how-to post, including considerations for mapping your outcomes and interventions.
If you’re along for the journey, let me start by giving you some preparatory tips.
Before Mapping
Assemble a squad
It’s important to involve partners and stakeholders to ensure that necessary perspectives are included and considered when indicating alignment. You’re likely to invite fellow staff, but make sure to also include students — you know, the people whom you serve and will be doing the learning.
It also won’t hurt to have staff from other departments offer their student development and success perspectives. Plus, faculty can help you articulate and justify your learning outcome connections.
Ensure a firm foundation
Make sure you’re starting with sound material. If you inherited your outcomes, it’s been a while since they were reviewed, or major campus changes have taken place (such as COVID-19 adjustments), make sure your outcomes are still relevant and reflective of your office.
And as you consider alignment beyond your area, you should also have a copy of the larger outcome framework from your division or institutional outcomes and learning goals. If appropriate, you should gather requisite accreditation standards, industry or professional competencies (from international orgs like ACPA and NASPA, as well as functional area organizations like NACA, NODA, AACRAO), strategic goals, or other elements which might help ground and prioritize activity.
Making Your Map
Once you have your people and resources gathered, it’s time to roll up your sleeves and get to work!

Although I’ve listed two big steps sequentially here, know there can be some parallel planning. You will need to think about the type and complexity of connections to best determine your structure. However, you should be mindful of doing too much complex alignment work if you plan to ultimately build or put that information into another format or tool.
Indicate alignment
Whether you draw or mark connections (yes, literally!), look to conceptualize and document the relationship between:
- Learning outcomes to operational objectives (to showcase how operations can relate to learning)
- Interventions to outcomes and objectives (to illustrate how activities, events, and resources relate and encompass operational and learning goals)
- Department outcomes to divisional or institutional outcomes (to relate area operations to larger initiatives)
- Department outcomes to additional requisite elements (such as accreditation standards or industry competencies) for external representation and validity
Determine your structure
There isn’t a single “right” or best way to construct your outcome map; there are many creative, cool ways to do so!
Spreadsheets are common, as there is a lot that can be represented and constructed with rows and columns. You can even create separate tabs, such as an “outcomes to intervention” tab and an “outcomes to larger framework tab”.
Visual maps can also be useful, wherein lines and arrows are drawn between elements to illustrate connections. Free and paid software like Plectica, Lucidchart, Google Sheets, and Microsoft Excel contain tools you could leverage for outcome mapping.
Make sure to check features of data managing software, data visualization software, assessment management software, and LMS at your institution for mapping tools. If those are not available to you, don’t shy away from Excel or Google Sheets because you think they’re too low-tech; examples provided in NILOA’s mapping toolkit highlight spreadsheet maps and this example from Carnegie Mellon University is a spreadsheet template.
Ultimately, think about what would be most useful for your connections across content. Brainstorm with your team!
Alignment Testing
As you look to indicate your connections, be careful of being what I call being “map-happy”. It’s easy to get carried away in thinking that a program, event, or service will have a profound impact to everyone for everything, and as a result, draw connections between everything.
Likewise, someone might have too much doubt or scrutiny for any alignment and thus, under-map connections that exist.
To help guide your mapping, I’ve created this three-part alignment test. There are three considerations to satisfy to pass the test for alignment mapping:
- Determine whether an outcome is required or expected as a result or an observation of intervention.
- Determine whether the intervention is intentionally designed to promote the outcome.
- Be confident in your ability to defend the connection and articulate its meaning to a third party.
Often, #1 will be evident, but the key is in having both #1 and #2 present to confirm outcome mapping or alignment to other outcomes, standards, artifacts, or interventions.
Below are examples where mapping should occur (“YES Example”) and where it should not occur (“NO Example”):
YES Example: A leadership program eventually asks students to articulate their leadership styles. The purpose (and focus of the program) is for students to apply leadership theory and peer learning to articulate their personal approach. A student organization advisor uses two-part considerations to map to the institution’s outcome of applied and collaborative learning:
- Part 1: Is applied and collaborative learning required or expected in the student leadership program for students? Yes.
- Part 2: Was the intention of the student leadership program to promote or enhance applied and collaborative learning? Yes. (In addition to specialized content about leadership, students are encouraged and expected to apply and collaborate in their learning to articulate their leadership style.)
- Parts 1 and 2 were satisfied, so this should be mapped.
NO Example: Through meetings, phone calls, and receiving student documents, The Office of Financial Aid strives to enhance financial literacy for students with respect to borrowing and managing financial aid resources. The purpose (and focus of Financial Aid efforts) is to observe financial literacy in action as students make financial decisions, responsibly borrowing according to their needs as opposed to just the max they can obtain. A Financial Aid professional uses two-part considerations to map to the divisional outcome of engaging diverse perspectives:
- Part 1: Are diverse perspectives expected to be present during Financial Aid interactions with students? Yes.
- Part 2: Was the intention of Financial Aid to promote or enhance learning around diverse perspectives? No. (Financial Aid, although entertaining diverse perspectives in the process, is set on promoting financial literacy which leads to responsible borrowing. While diverse perspectives may exist, they were not the intention. So credit for learning, or concern where it lacks, should not apply here.)
-
- Parts 1 and 2 were not satisfied, so this should not be mapped.
After doing your mapping, if you’re still unsure, consider the third part to the mapping test. Would you feel comfortable explaining the connection to your supervisor? How about to a faculty member? If you don’t feel confident or think it might be a stretch, it’s better to say no and not map the connection for now.
Mapping Examples
Below are a few examples, ranging from simple to somewhat complex or formal. My aim in sharing is more to demonstrate form than for you to focus on the language.
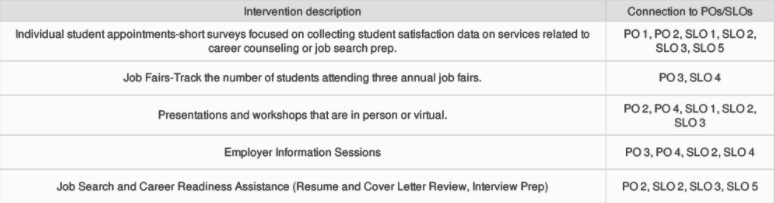
Example 1: Career Services aligning interventions (left column) to learning outcomes and process objectives (right column)
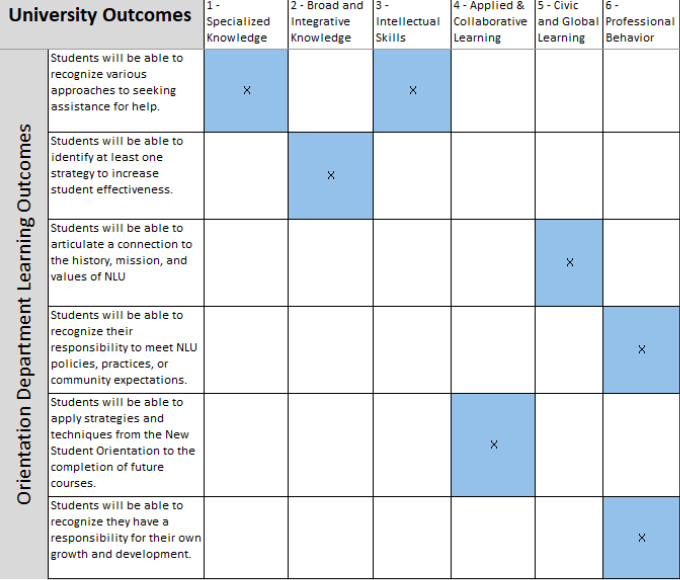
Example 2: Orientation learning outcomes (left-most column) aligned to institution-level outcomes (top row/right columns)
Reviewing Your Map
Once you’ve created your map, take a step back and review your work. When you are able to zoom out from individual outcome connections, you might notice gaps or redundancies across the department. Maps help allow for quick visual scans to examine coverage among and between elements in the map.
Send your map to others for feedback. Even if you had your squad helping you at each step along the way, share with other staff, students, or faculty. Does the determined map structure clearly present what’s going on? Do the connections depicted in the map make sense or is it too busy to understand?
Sharing your map with others can inform improvements and may also give ideas or inspiration to other areas for their alignment work.
While there is certainly more which could be said and more ways in which to structure or display outcome maps, I hope this has been a good primer for how to go about this work.
If you have tips, examples, or approaches to creating outcome maps that you would like to offer, feel free to be in touch to share via @themoderncampus and @JoeBooksLevy. Stay tuned for the third installment to this outcome mapping series on ways to get the most use out of your maps!
This is Part Two in a series on outcoming mapping. Part One can be found here.